PESTILE
Category: Strategic Planning
What is a Gantt Chart?
A Gantt chart is a type of bar chart used to visualize project schedules. It illustrates the start and end dates of individual tasks in the project, their duration, and how these tasks overlap and connect with each other.
Simply put, it's a powerful tool that shows "Who does what and when."
Who created it?
The chart is named after Henry Gantt, an American engineer and management consultant who developed and popularized it around 1910-1915. Although similar charts were used before him, he brought it to its modern form.
Key components of the Gantt chart:
- Task list: Located in the leftmost column. This is a vertical list of all activities needed to complete the project.
- Timeline: The horizontal axis at the top of the chart that shows the project's time period (days, weeks, months).
- Bars/Lines: Horizontal bars, each representing one task. The bar's position shows the start and end date, while its length shows the task duration.
- Milestones: Special markers (often diamonds) that denote key events or achievements in the project (e.g., "go-live", "client approval"). They have zero duration.
- Dependencies (Links): Thin lines connecting bars that show the sequence of tasks (e.g., "Task B cannot start until Task A is completed"). Usually visualized with arrows.
- Progress: Bars are often partially filled with color to show what percentage of the task is completed.
- Resources: Often the name of the person or department responsible for each task is added.
Here's how it looks in practice:
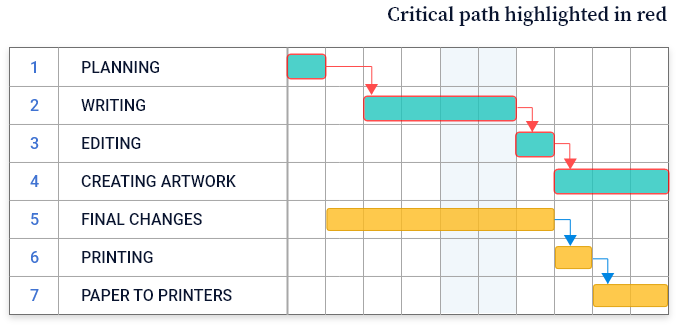
(This is a simplified text version. In real software tools, charts are much more visual and interactive.)
What are they used for? (Advantages)
- Planning: To clearly see what tasks are needed and how much time the overall project will take.
- Progress tracking: Easy to see which task is in progress, completed, or behind schedule.
- Resource allocation: Helps understand who is working on what and prevents overloading one person with too many tasks simultaneously.
- Communication: Provides a clear and easy-to-understand visual view of the entire project for all stakeholders (managers, team, clients).
- Identifying dependencies: Shows which tasks are critical and cannot be delayed without affecting the entire project.
Disadvantages
- Can become overly complex: For very large projects with hundreds of tasks, the chart can become unwieldy and difficult to read.
- Doesn't show resource details: While it shows who is responsible, it doesn't show detailed workload, costs, or skills needed for the task (for this, it's often integrated with other tools).
- Doesn't update itself: When something changes in the project (delay, new task), the chart must be manually updated, although modern software automates this process.
Modern tools
Today, Gantt charts are rarely made on paper or in Excel. Specialized tools exist that make them powerful and interactive. Some popular examples are:
- Microsoft Project: A classic in the field
- Jira: (especially popular in software teams)
- Asana:
- Trello: (with Power-Ups)
- ClickUp:
- Smartsheet:
- TeamGantt:
- GanttPRO:
In conclusion: The Gantt chart is one of the most fundamental and effective project management tools, translating a complex task list into a clear visual plan that everyone can understand.